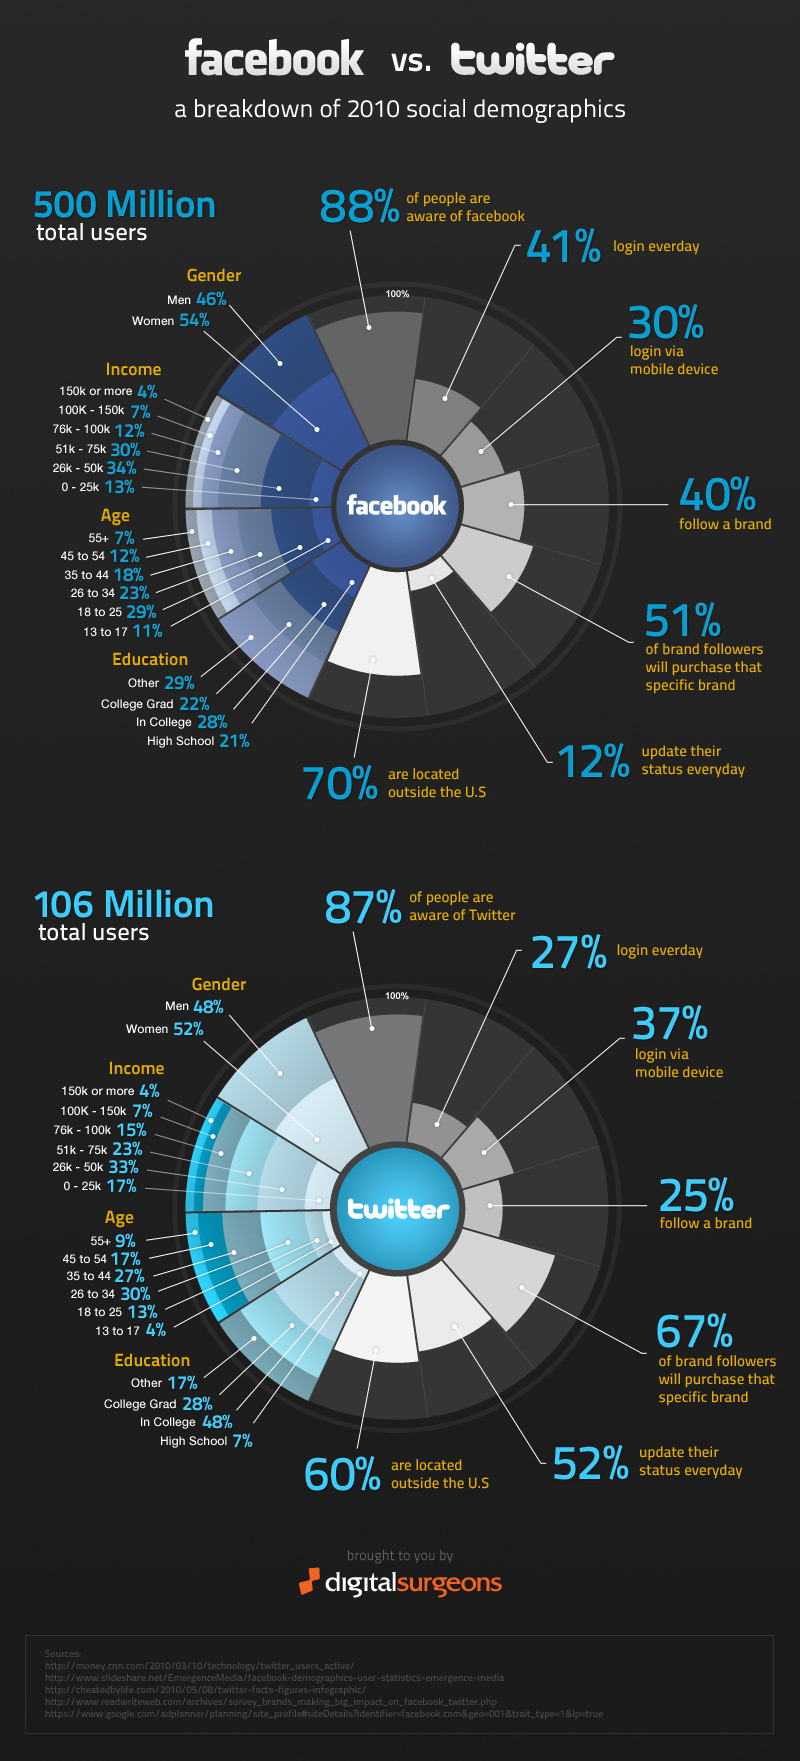
If there’s two things marketers, agencies, social media practicers love it’s demographics and infographics. Well, at least I do. The Facebook vs twitter 2010 social demographics infographic by Digital Surgeons provides something for all three.

Source: digitalsurgeons
From a brand perspective it’s interesting to see that on Facebook 40% of their users follow a brand vs Twitter where on 25% of their users does the same.
What static from the the Facebook vs twitter 2010 social demographics infographic stands out to you?