2016 Mobile App Development Trends – Infographic
infographics
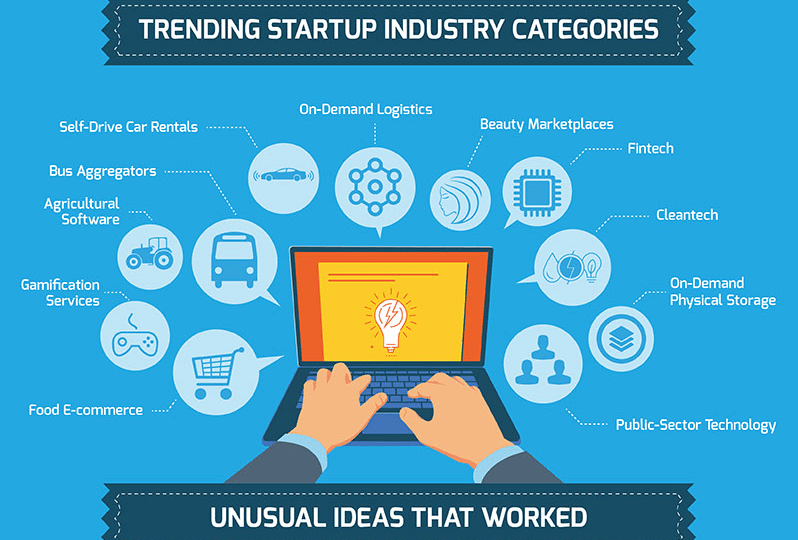
27 Striking Facts Most People Don’t Know About Startups – Infographic

8 Web and UI Design Trends For 2016 – Infographic Design Trends 2016 Infographic via CoastalCreative.com
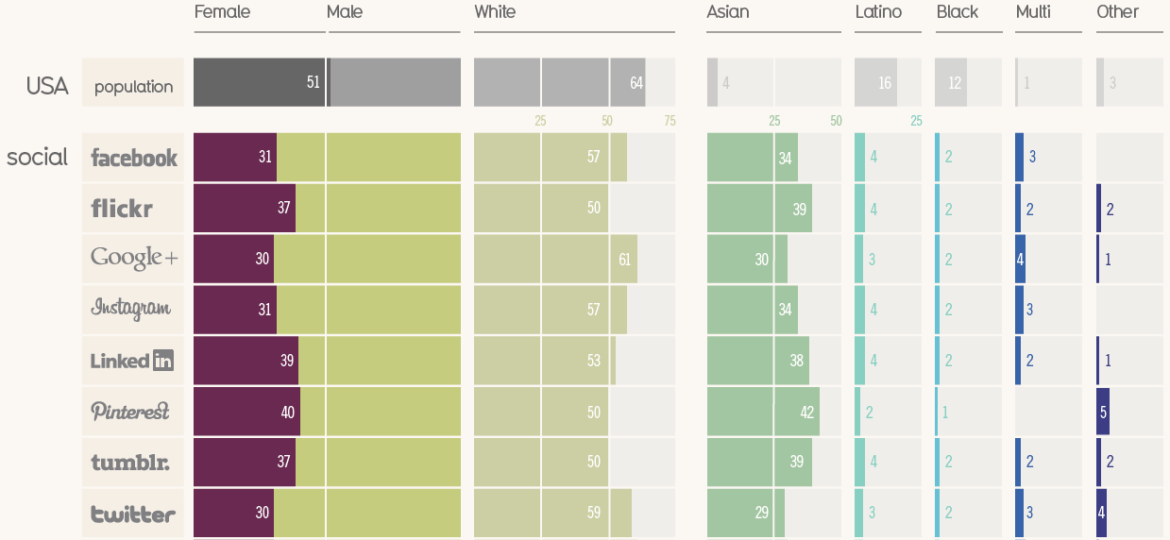
Which tech companies employ the most people of colour and which are more of a whitewash? We…


13 Ways To Become Extraordinary Entrepreneur – Infographic via http://techinfographics.com/