Last month Pew Research Center released data on wealth inequality. The research reports some staggering numbers on the average household income differences in America between Blacks, Whites and Hispanics. Below are some of their key data points.
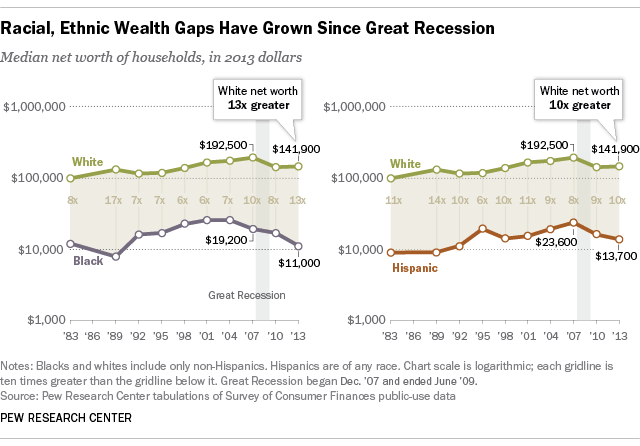
1. The wealth of white households was 13 times the median wealth of black households in 2013, compared with eight times the wealth in 2010, according to a new Pew Research Center analysis of data from the Federal Reserve’s Survey of Consumer Finances.
2. The current gap between blacks and whites has reached its highest point since 1989, when whites had 17 times the wealth of black households.
3. Analysis of Federal Reserve data does reveal a stark divide in the experiences of white, black and Hispanic households during the economic recovery. From 2010 to 2013, the median wealth of non-Hispanic white households increased from $138,600 to $141,900, or by 2.4%.
4. The median wealth of non-Hispanic black households fell 33.7%, from $16,600 in 2010 to $11,000 in 2013. Among Hispanics, median wealth decreased by 14.3%, from $16,000 to $13,700.
5. White households are much more likely than minority households to own stocks directly or indirectly through retirement accounts. Thus, they were in better position to benefit from the recovery in financial markets.
6. The racial and ethnic wealth gaps in 2013 are at or about their highest levels observed in the 30 years for which we have data.
The question is now that we know… what are we going to change and do about it?